
Introduction
Java heap dumps and thread dumps are a powerful way to investigate what’s going on in the Java Virtual Machine (JVM). A heap dump allows you to see what is kept in memory after a minor and major garbage collection. Therefore, heap dumps provide indispensable insights that can be used for troubleshooting memory leaks. Heap dumps are stored in binary hprof files.
Creating Heap Dump
JCMP
Open a command prompt and run the following command to find the process ID of the Java process, and then run jcmd command to generate hprof file. The jcmd the utility is used to send diagnostic command requests to the JVM, where these requests are useful for controlling Java Flight Recordings, troubleshooting, and diagnosing JVM and Java Applications
- ps aux | grep java
- jcmd 63578 GC.heap_dump ./heapdump.hprof
Files location can be found by running the below command.
- lsof -p 63578 | grep cwd
Java memory Fundamentals
Heap Memory
- The JVM divides its memory into two main categories: heap memory and non-heap memory
- Heap memory: is the part where objects that are created by the application are stored. They remain there until they are no longer referenced and are garbage collected
- The JVM’s non-heap memory is divided into several different areas.
Non-heap memory
- Compressed class space: used to store information about the classes that have been loaded. Constrained by MaxMetaspaceSize. A function of the number of classes that have been loaded.
- Thread: memory used by threads in the JVM. A function of the number of threads that are running.
- Code cache: memory used by the JIT to store its output. A function of the number of classes that have been loaded. Constrained by ReservedCodeCacheSize. Can be reduced by tuning the JIT to, for example, disable tiered compilation.
- GC: stores data used by the GC. Varies depending on which garbage collector is being used.
- Symbol: stores symbols such as field names, method signatures, and interned strings. Excessive symbol memory usage can be an indicator that Strings have been interned too aggressively.
- Internal: stores other internal data that does not fit into any of the other areas.
Differences b/w Heap & Non Heap
- Compared to heap memory, non-heap memory is less likely to vary under load.
- Once an application has loaded all of the classes that it will use and the JIT is fully warmed up, Non heap will rarely increase its size.
Generations
- The heap is split into several different sections, called generations
- As objects survive more garbage collections, they are promoted into different generations. The older generations are not garbage collected as often. Because these objects have already proven to be longer lived, they are less likely to be garbage collected.
- When objects are first constructed, they are allocated in the Eden Space. If they survive a garbage collection, they are promoted to Survivor Space, and should they live long enough there, they are allocated to the Tenured Generation. This generation is garbage collected much less frequently.
- There is also a fourth generation, called the Permanent Generation, or PermGen.
- The objects that reside here are not eligible to be garbage collected and usually contain an immutable state necessary for the JVM to run, such as class definitions and the String constant pool
OutOfMemoryError
If there is not enough memory available to allocate for object, the JVM attempts to reclaim some memory from the heap with a garbage collection. If it still cannot obtain enough memory, an OutOfMemoryError is thrown, and the JVM exits.
Heap Analysis
Step 1: Capture heap dump during early stage
Start your application. Let it take real traffic for 10 minutes. At this point capture heap dump. Heap Dump is basically snapshot of your memory. It contains all objects that are residing in the memory, values stored in those objects, inbound & outbound references of those object.
Step 2: Capture heap dump before application crashes
After doing step #1, let the application run. Before application crashes take another heap dump once again. Often times it might be challenging to capture heap dumps before it crashes, because we don’t know when application will crash. Is it after 30 minutes, 3 hours, 3 days? Thus, it’s ideal to start your application with following JVM property.
-XX:+HeapDumpOnOutOfMemoryError -XX:HeapDumpPath=/opt/tmp/heapdump.bin
Step 3: Analyze heap dumps
•Objects which are causing memory leaks grow over the period. If you can the identify objects whose size has grown between the heap dumps captured in step #1 and step #2, then those are the objects which is causing memory leak.
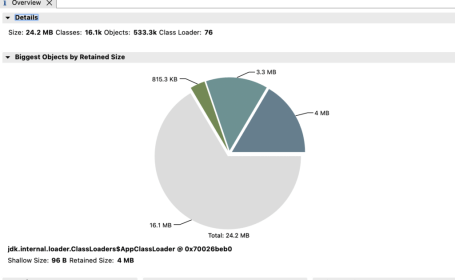
• When you load the heap dumps in to any of the tool, there will be a section reporting largest objects in the memory. Compare this section between heap dump captured in step #1 and step #2. If you notice any abnormal growth of objects, then they are the ones which is causing memory leak in your application.
Eclipse Memory Analyzer
- The Eclipse Memory Analyzer provides a general purpose toolkit to analyze Java heap dumps.
- Besides heap walking and fast calculation of retained sizes, the Eclipse tool reports leak suspects and memory consumption anti-patterns.
- The main area of application are Out Of Memory Errors and high memory consumption.
- Installation – •https://eclipse.org/mat/downloads.php
Overview
Histogram
•list the number of instances per class, the shallow size and the retained size .
•Shallow heap is the memory consumed by object & Retained Heap is the memory kept alive by object.

JProfiler
Jprofiler is another tool that can be used to do heap Analysis, it shows better view of references
